2019 VOLVO V60

2019 ASG AWARDS: Best 5 All-Around Performance

NOTEWORTHY ASG FINDING: Among the best 5 Wagons in 2019, rising to the top of a refreshed segment that includes 38 wagon variants.

ALL-AROUND PERFORMANCE RATING: 96

  • ENVIRONMENTAL PERFORMANCE RATING: 97
  • ECONOMIC PERFORMANCE RATING: 70
  • SOCIAL PERFORMANCE RATING: 96


ASG’s annual study found the All-New 2019 Volvo V60 to offer exceptional all-around performance, earning the distinguished BEST 5 ALL-AROUND PERFORMANCE Award. In ASG’s data-driven automotive assessment, the V60 landed a spot among the Best 5 wagons in 2019, rising to the top of a refreshed segment that includes 32 model variants. 
ASG’s all-around performance analysis is a comprehensive data-driven assessment, analyzing economic, environmental and social performance indicators across a vehicle’s life-cycle, and in relative comparison to all competitive vehicles in the market. 

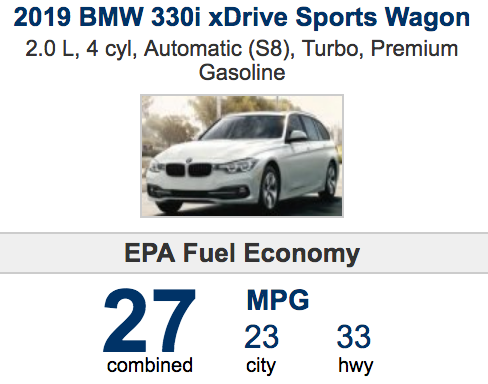
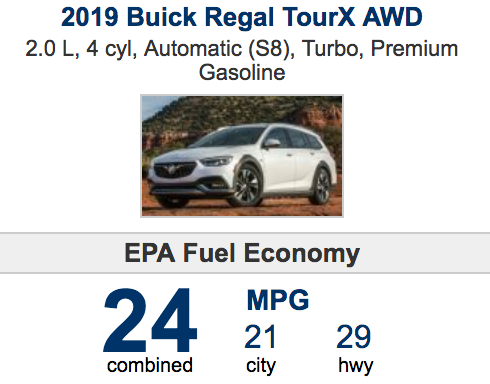
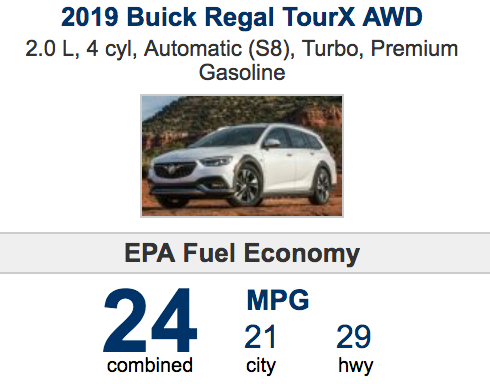
In ASG’s environmental performance assessment, the Volvo V60 maintained a life-cycle carbon footprint that is 9% smaller than the average vehicle in the segment, with 429 grams of CO2-e emissions per mile driven lifetime [accounting for resource extraction, processing, vehicle assembly, delivery, use with upstream fuel phases, and end-of-life management]. While the Subaru Outback was the only vehicle with a slight edge on the V60 with 424 grams of CO2-e per mile driven lifetime, the V60 outperformed all other wagons by a significant margin, including the Audi A4 allroad, BMW 330i xDrive Sports Wagon, Volkswagen Golf Alltrack, Buick Regal TourX, Mercedes-Benz E-450 Wagon, Jaguar XF Sportbrake and the Fiat 500L. 
 
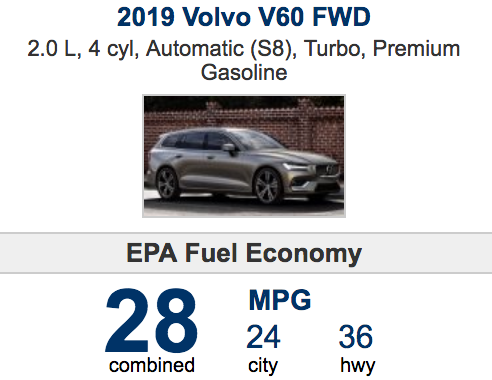
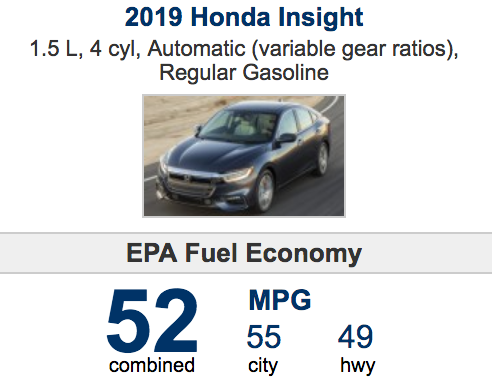
With an EPA estimated 28 MPG combined (city/hwy), the V60 holds a 3 MPG advantage over the average vehicle in the segment; but for those relying more on highway driving, the V60's 36 MPG hwy is best-in-class with a 6 MPG advantage over the average vehicle in the segment. Only the Volvo V90 comes even close with its 35 MPG hwy.

Related Items


RELATIVE RATING METHOD

The Automotive Performance Index (API) applies statistical methods to demonstrate each vehicle rating in relative comparison. For example, the vehicle that performs highest in environment performance in a given class obtains a rating score of 100. Each vehicle in its class is then compared relative to the top-performing vehicle with a rating score reflecting the statistical difference in performance outcomes. A score of 91 translates to a 9% environmental performance deficit as compared to the top-performing vehicle.  

Due to the API’s relative vehicle rating method, vehicle class divisions were identified as a critical input - these class divisions are detailed here.

While the Automotive Performance Index is indeed an exhaustive list of vehicles to trim level detail, with each vehicle assessment reporting over 200 unique data outputs (the culmination of thousands of data inputs), ASG has taken additional measures to ease the burden of sorting through all data points and all vehicle assessments. We have developed key performance categories and sorted all vehicles in each class according to Environmental Performance, Social Performance, Economic Performance and All-Around Performance. The vehicle in each class with the best score in each unique category is named the performance award winner (i.e. Best Environmental Performance Award winner). The vehicle in each class that scores highest combined scores in Environmental Performance, Social Performance and Economic Performance is named the ASG Best All-Around Performance Award winner.

One step further, we also name the Best 5 All-Around Performance Award winners in each class to provide consumers with a concise product comparison guide.