2018 NISSAN ROGUE

The Nissan Rogue once again lead the Automotive Science Group’s (ASG) 2018 Automotive Performance Index™ (API), demonstrating the full capabilities of Nissan’s crossover platform. With an EPA estimated 33 MPG highway (26 city/33 hwy/29 combined), the Rogue outshines competitors in class by an average 7 MPG highway, proving to skeptics that significant fuel economy gains in the mid-size SUV segment are attainable, earning ASG’s 2018 BEST ALL-AROUND PERFORMANCE Award.

ASG’s all-around performance analysis is a comprehensive data-driven assessment, analyzing economic, environmental and social performance indicators across a vehicle’s life-cycle, and in relative comparison to all competitive vehicles in the market.

The Rogue earned a class leading all-around performance rating in ASG’s Study, outperforming the average vehicle in its segment by an astounding 21%. The Rogue lead notable competitors including the Mitsubishi Outlander and Honda CR-V with a 3% advantage, and the Subaru Forester and Hyundai Santa Fe Sport by 5% and 8% respectively.

ASG found the 2018 Nissan Rogue to offer the best all-around performance and value in class, and across its life-cycle.

The Nissan Rogue leverages an efficient 2.5 Liter engine to deliver fuel efficient transport in the mid-size SUV segment, without the need for advanced powertrain components. In fact, the Rogue’s light weighting strategy gives it significant weight advantage across the segment, coming in at 816 pounds lighter than the average curb weight in class. Less resources translates to reduced environmental footprint, increased operational efficiency and reduced life-cycle operating costs.

The Nissan Rogue is a steady performer of exceptional value, earning ASG’s distinguished honor in 2018.


Related Items


RELATIVE RATING METHOD

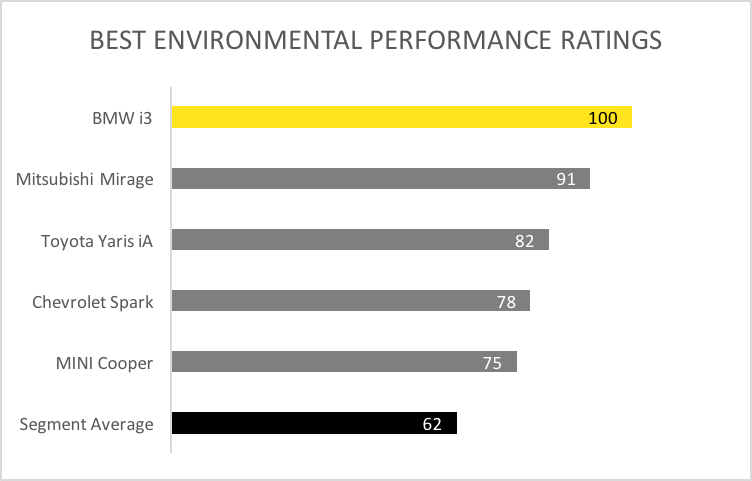
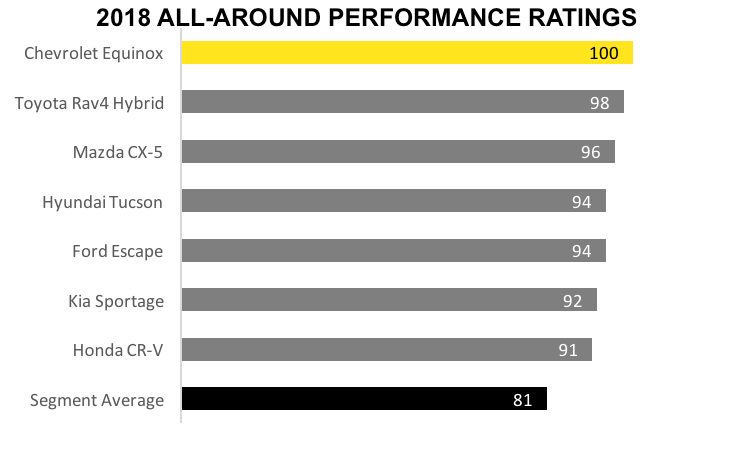
The Automotive Performance Index (API) applies statistical methods to demonstrate each vehicle rating in relative comparison. For example, the vehicle that performs highest in environment performance in a given class obtains a rating score of 100. Each vehicle in its class is then compared relative to the top-performing vehicle with a rating score reflecting the statistical difference in performance outcomes. A score of 91 translates to a 9% environmental performance deficit as compared to the top-performing vehicle.  

Due to the API’s relative vehicle rating method, vehicle class divisions were identified as a critical input - these class divisions are detailed here.

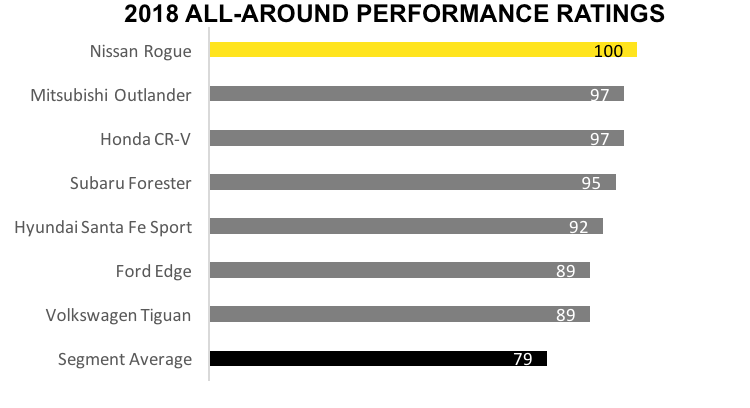
While the Automotive Performance Index is indeed an exhaustive list of vehicles to trim level detail, with each vehicle assessment reporting over 200 unique data outputs (the culmination of thousands of data inputs), ASG has taken additional measures to ease the burden of sorting through all data points and all vehicle assessments. We have developed key performance categories and sorted all vehicles in each class according to Environmental Performance, Social Performance, Economic Performance and All-Around Performance. The vehicle in each class with the best score in each unique category is named the performance award winner (i.e. Best Environmental Performance Award winner). The vehicle in each class that scores highest combined scores in Environmental Performance, Social Performance and Economic Performance is named the ASG Best All-Around Performance Award winner.

One step further, we also name the Best 5 All-Around Performance Award winners in each class to provide consumers with a concise product comparison guide.